All posts by admin

Pedestrian Priority and Australia, Where the Car is Still King

IMG_5764Image Sandy James

If you think the car is king in Metro Vancouver and in Canada generally, you need to have a visit to Australia where both the law and the pedestrian crossing times solidly put the pedestrian as a second class citizen to vehicular traffic.

The Guardian disclosed that “Pedestrians across Australia are pressing the button at traffic lights for no reason, most days of the week..In Sydney, pedestrian crossings in the CBD have been automated since 1994, leaving millions of commuters to futilely press placebo buttons for nearly 25 years…”

And if you are standing at an intersection in downtown Sydney, you feel like you are standing there for an inordinate amount of time waiting for a light to change.

There are a lot of walkers~there are 1.27  million trips a day in the downtown, with 1.06 million by foot.  The State Department in charge of the wait times have thankfully shortened  the automated wait times from 110 seconds to 90 seconds, but here is what is strange~an official from the State said “when traffic volume is lower the pedestrian wait time is less than 90 seconds. There are also many locations in the CBD where traffic signals operate with a double cycle, meaning pedestrians only wait 45 seconds to cross the road.”

But no one is talking about the fact that Sydney’s CBD is full of walkers and quite congested at the intersections at peak times. Shouldn’t pedestrians have more green time when foot traffic volume is higher? And shouldn’t pedestrians’ time be counted as valuable if not more so than vehicular traffic?

Darren Davis with Auckland’s Transport Council has crunched the numbers of the economic viability of walking. His work shows that eight billion dollars of New Zealand’s  gross domestic product is generated within a few city blocks, and it is “walkability  of a city centre directly impacts its economic viability and economic prosperity.”

That is part of what London is doing in the Mayor’s new Transport Strategy as reported in Price Tags. Aiming for an 80 per cent modal split for walking,cycling and public transport by 2041,  London is becoming more conducive for walking by making wait times at intersections as low as 40 seconds.

Cities with walkable downtowns are attractive for businesses to locate, and pedestrians are the economic driver to make those areas thrive. It is time to cost the pedestrian experience for comfort, convenience and safety in the downtown as paramount to that of the vehicle, signalling a shift in accountability and livability of the downtown core. The chart below illustrates the pedestrian wait times in cities in Australia and elsewhere.


Embedded video

Halloween, November and the Winter Pedestrian Danger Months


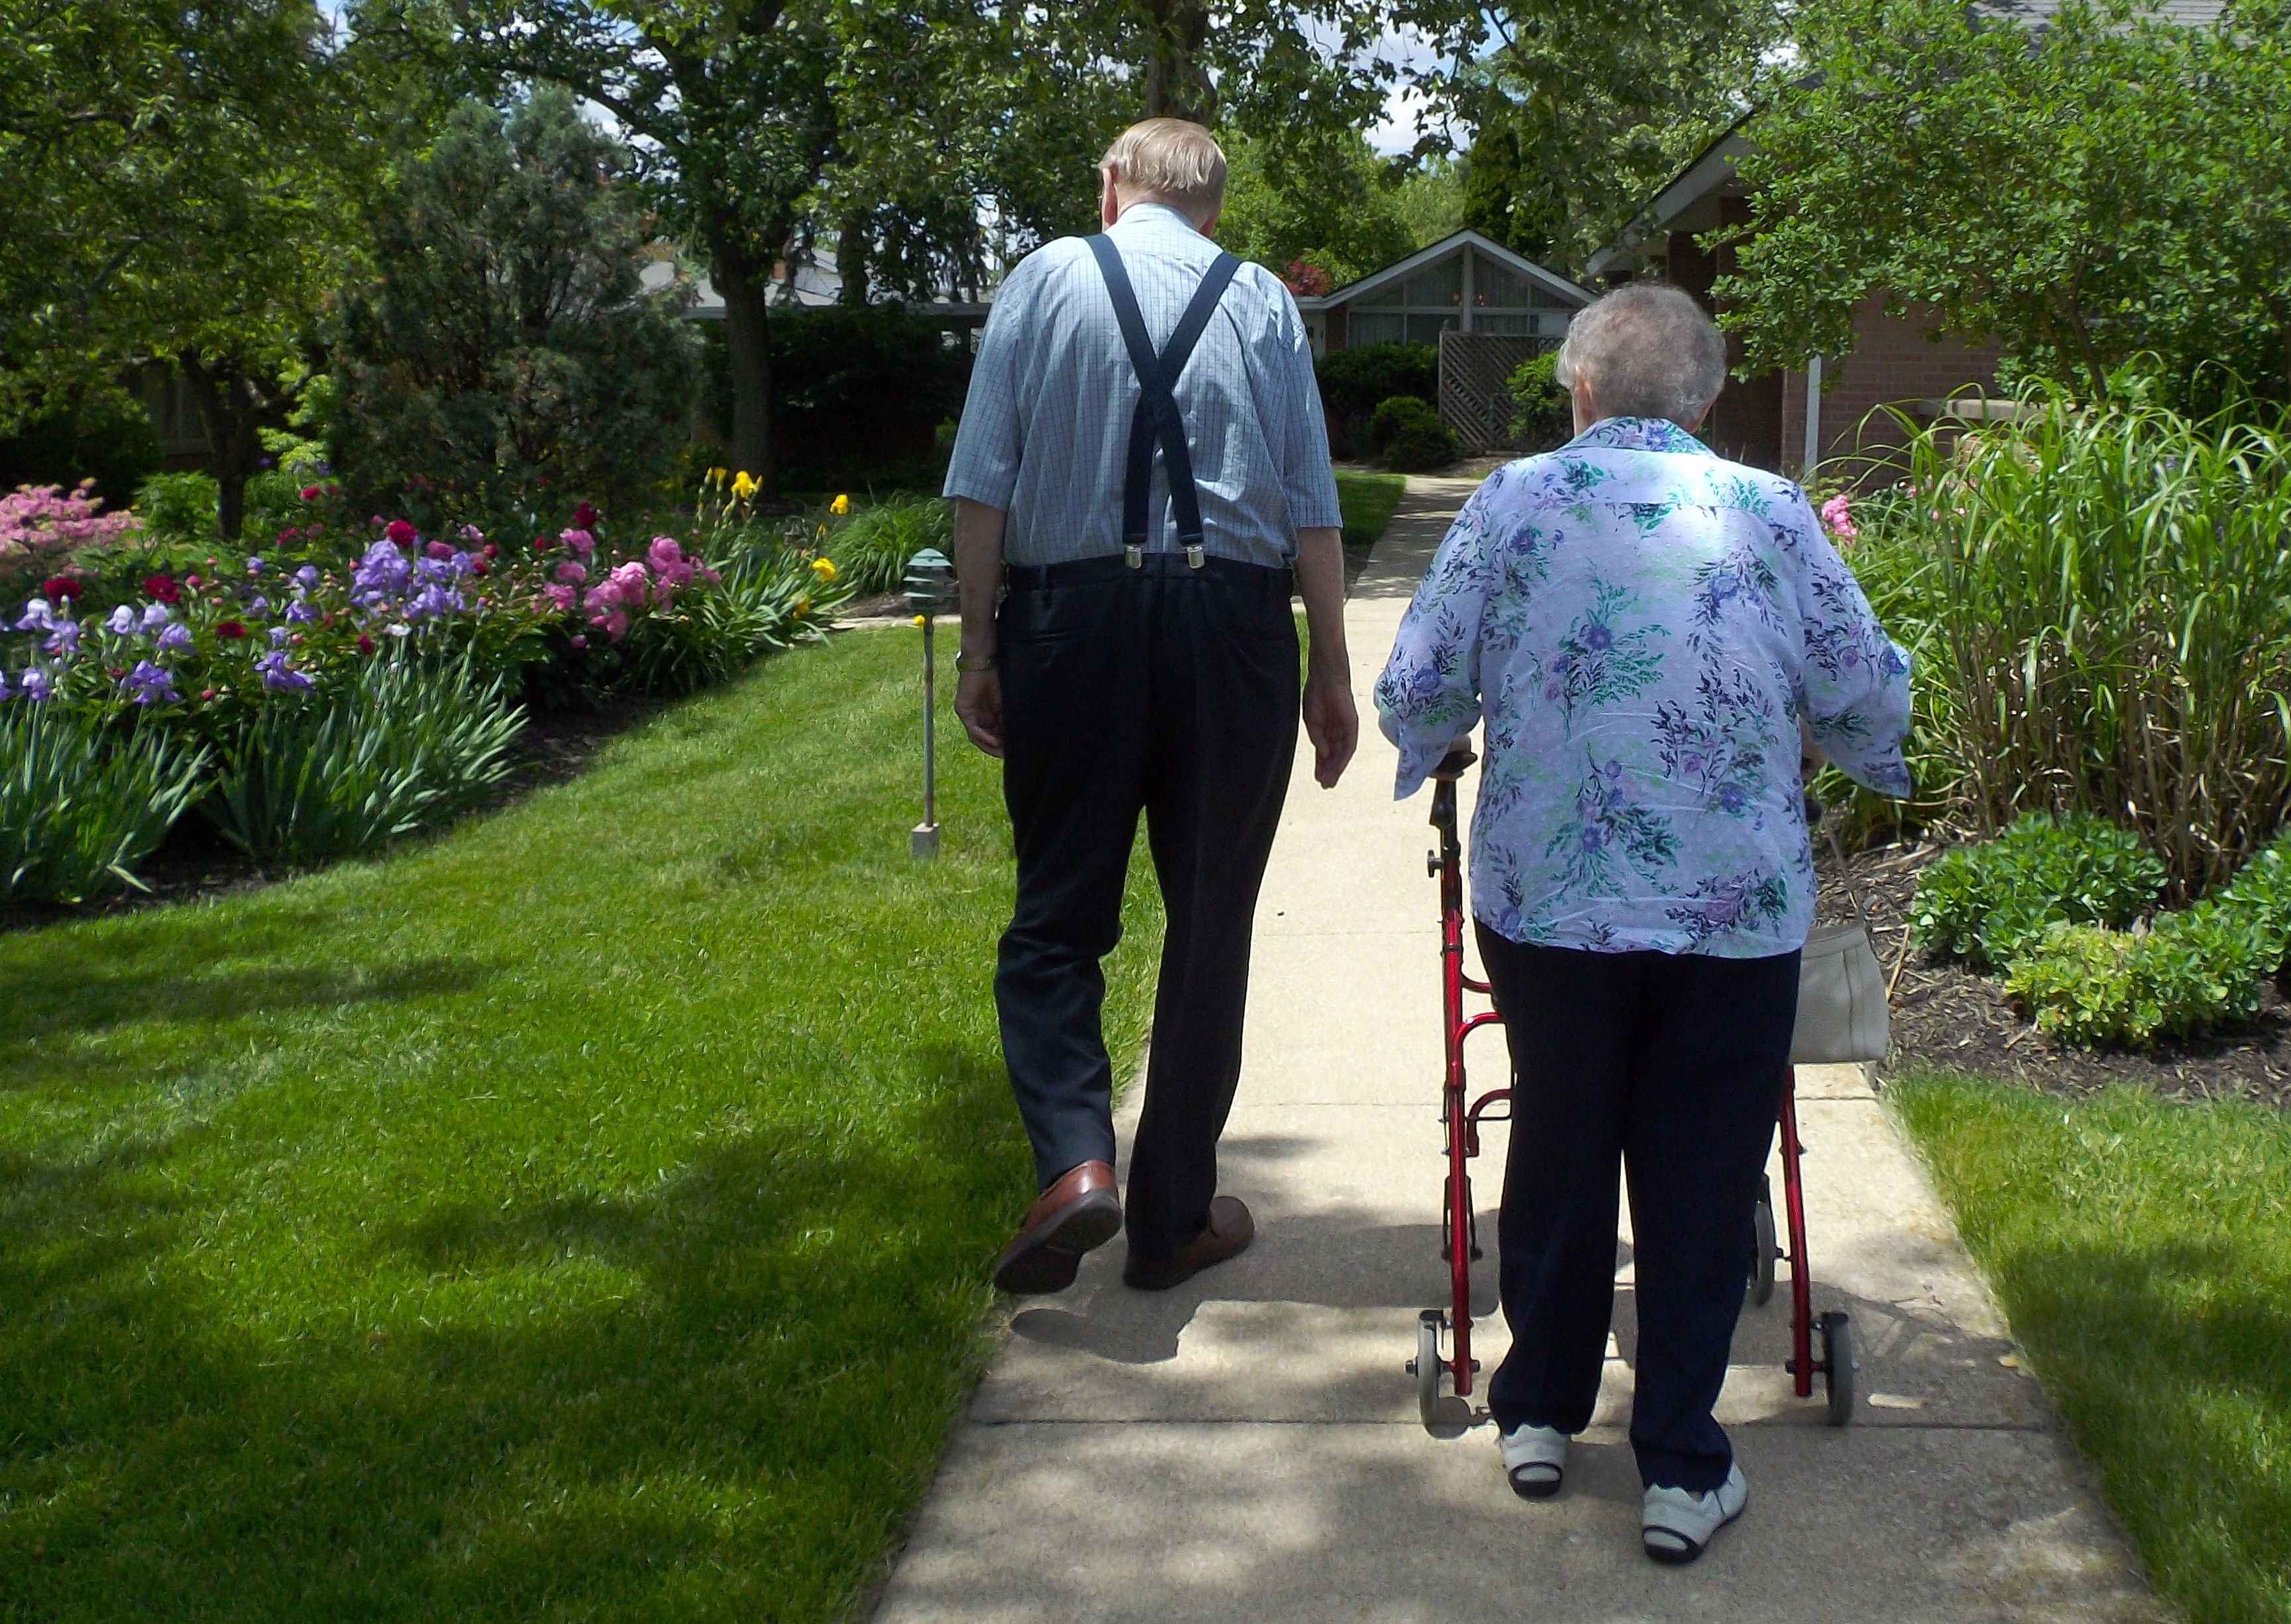
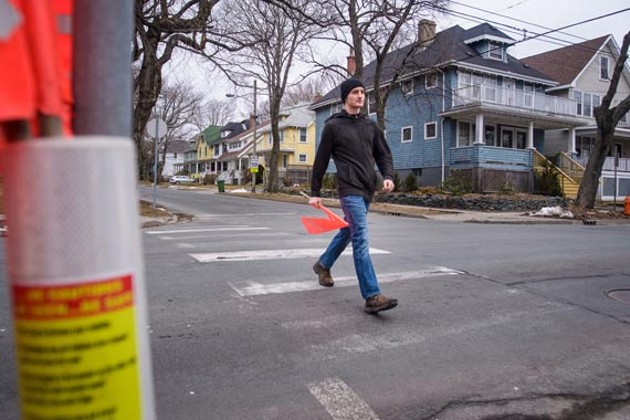
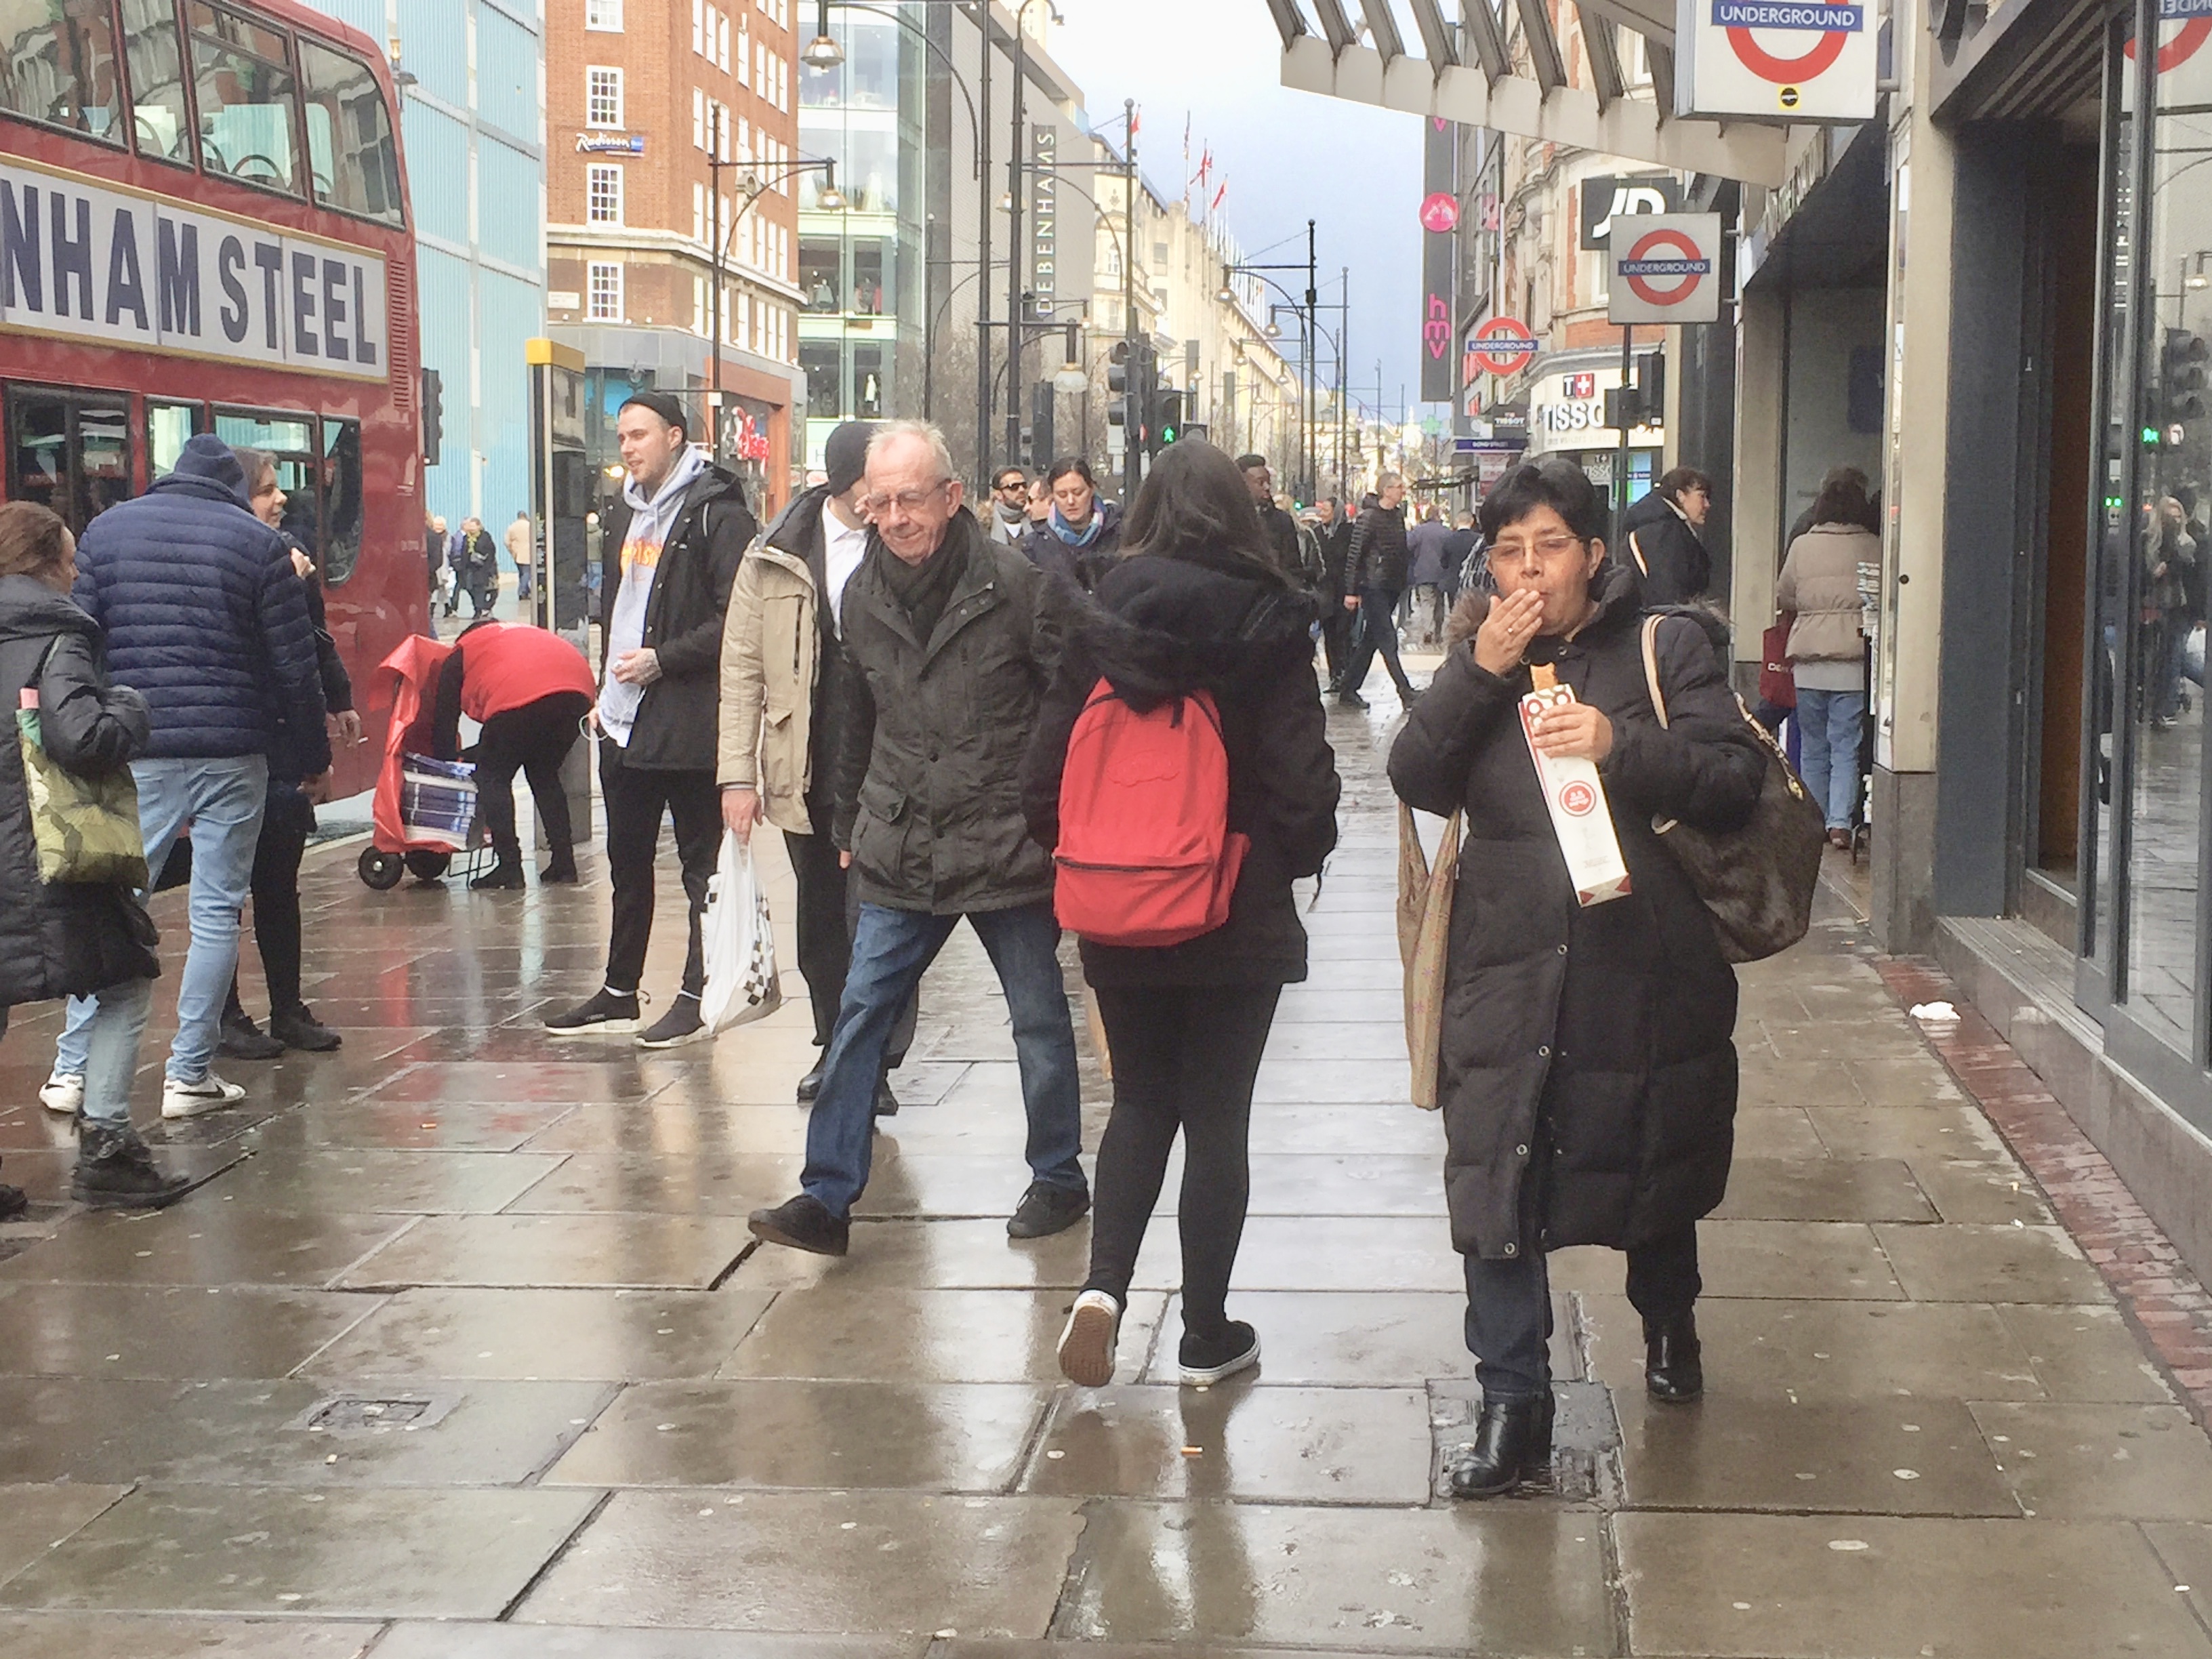
This time of year is also the danger zone for pedestrians. The Insurance Corporation of British Columbia (ICBC) observes that November, December, and January are months when vehicles crash into pedestrians, with dusk being the worst time. Even more sobering 75 per cent of pedestrians are being crashed into at intersections, with 57 per cent of those crashes happening when the pedestrian actually was legally crossing and had the right of way.

As reported in the Vancouver Sun  a study involving University of British Columbia researchers have identified Halloween night as having a 43 per cent higher risk of pedestrian deaths than any other night close to that date. Using available traffic data from the United States, the researchers looked at 608 pedestrian deaths that occurred on 42 previous Halloween nights, and found similar findings to that of a study done 20 years ago.

Despite the fact that vehicles are equipped with better safety systems and lights, “car-pedestrian accidents kill four more people on average on Halloween than on other days…Kids aged 4 to 8 faced the highest risks in the new study: There were 55 Halloween deaths in this age range compared with just 11 on control days.”

Why would children between ages 4 to 8 be more likely to die? Researchers think that because of the excitement of the holiday that kids forget about vehicular danger. Children are also below the visibility sight lines on many of the bigger SUVs being driven today. The study also concluded that deaths peak at dusk.

An American  university study found  that children between the ages of 6 and 14 years of age were not able to judge the speed, distance, and  judge the safe crossing time in moving traffic.  Advice given for a safe Halloween for young trick or treaters include “Attach reflective patches to costumes, carry a flashlight or glow stick to be more visible, make sure masks don’t obstruct vision, and look both ways before crossing the street.” 

Those reflective patches on kids’ outwear are a requirement in Finland, and have contributed to lowering the fatality rate in that country.

And for motorists during the wet cold winter months? Slow down, change your driver behaviour, and remember to watch for pedestrians.


Enter-if-you-DARE-under-4-easy-scary-door-via-Home-Jelly

Daily Hive Image

Paris Bus Driver Accessibility Hero

paris-arc-de-triomphe-wheelchair1

You find heroes in the most unlikely places. The Evening Standard  reports on the plight of Francois Le Berre who was waiting in his wheelchair to get on a bus in the suburbs of Paris. Mr. Le Berre has multiple sclerosis and needed the front area of the bus to be cleared off in order to board the bus. Unfortunately no passenger would move from the front area to allow Mr. Le Berre to safely board.

Seeing the situation, the bus driver announced that the route was terminating at the bus stop and demanded that all passengers leave the bus. He then assisted Mr. Le Berre to board in his wheelchair and drove off with just Mr. Le Berre as a passenger. And surprise! Under the  twitter name “Accessible POUR TOUS” the story has been liked over 12,000 times. And while many of the comments are congratulatory to the bus driver, that ever so gallic  point of view also snuck in with one bus rider stating “If you had been on that bus you would not have moved either”.


Increasing Speeds on B.C. Highways Caused More Road Deaths

Image: CBC

Increasing speed limits on several British Columbia highways caused  carnage and a higher accident rate and was a  failed experiment of the previous Liberal Provincial government. It has  already been written about the 118 percent increase in road deaths and 43 percent increase in vehicular claims received by ICBC, the Insurance Corporation of British Columbia. With higher speed limits implemented in 2014, the past Provincial government was not nimble in addressing the increasing road deaths and insurance claims as reported by researchers.

Claire Trevena, the Minister of Transportation for the Province has now announced an immediate decrease in speed limits on fifteen highway segments based upon a review of the serious and fatal crashes that have occurred in the past three years. These lower speed limits will be on the Sea to Sky Highway, the Okanagan Connector, the Island Highway and some sections of Highway 1.

The Minister also connected the lower speed limits to reducing the incidence of speed related crashes.

“We are making every effort now … to make sure that people can travel safely on our highways. Nobody should be dying on our highways.”

The change to lower speed limits will mean that 570 kilometers of highway will need to have speed limit signs replaced, a task to be completed this week.

It’s no surprise that a small group of male advocates continue to press for increased speeds. They say that travelling faster is not impacted by road condition, terrain, changeable weather or shorter reaction times, and somehow feel that the increased deaths and injuries are due to other factors, such as more people travelling. It’s also no surprise that they have no statistical data to back up their claims.

In his groundbreaking report Where the Rubber Meets the Road  former B.C. Medical Health Officer Dr. Perry Kendall named vehicular accidents as a major cause of death in the province, responsible for nearly 300 annual deaths.  Between 2008 and 2012 the top contributing factors to fatal crashes were speed (35.7%) distraction (28.6%) and impairment (20%). It simply makes sense to lower speeds to increase safe travel.

Lower speed limits also need to be enforced. As transportation expert Ian Fisher notes enforcement must happen to ensure speed limits are complied with, and the use of radar detectors should be banned. In an era where vehicles are full of protection systems for occupants, why do we still insist on police being vulnerable road users in stopping vehicles that are speeding? Why can we not utilise universal camera enforcement like the Swiss, who have one of the lowest fatality and crash levels in Europe? With the funding of course going back to make separated bikeways and safer pedestrian crossings at appropriate locations. What will it take? You can take a look at the speed limit roll backs below.

View image on Twitter

Speed limits are being rolled back by 10 km/h on the following highway corridors:

Highway 1: Cowichan Bay to Nanaimo — 90 km/h to 80 km/h
Highway 1: Whatcom Road to Hope — 110 km/h to 100 km/h
Highway 1: Boston Bar to Jackass Mountain — 100 km/h to 90 km/h
Highway 1: Tobiano to Savona — 100 km/h to 90 km/h
Highway 1: Chase to Sorrento — 100 km/h to 90 km/h
Highway 3: Sunday Summit to Princeton — 90 km/h to 80 km/h
Highway 7: Agassiz to Hope — 100 km/h to 90 km/h
Highway 19: Parksville to Campbell River — 120 km/h to 110 km/h
Highway 19: Bloedel to Sayward — 100 km/h to 90 km/h
Highway 97A: Grindrod to Sicamous — 90 km/h to 80 km/h
Highway 97C: Merritt to Aspen Grove — 110 km/h to 100 km/h
Highway 97C: Aspen Grove to Peachland — 120 km/h to 110 km/h
Highway 99: Horseshoe Bay to Squamish — 90 km/h to 80 km/h
Highway 99: Squamish to Whistler — 100 km/h to 90 km/h
Highway 99: Whistler to Pemberton — 90 km/h to 80 km/h
With files fro


Do Flags at Intersections Makes the Streets Safer? Halifax Thinks So.

coast-crosswalk-1

From Halifax Nova Scotia,  The Globe and Mail reports on the “Crosswalk Safety Society” that are placing “high-visibility flags” on crosswalks where there are no crossing lights and no safety features. While staff at the Halifax Regional Municipality urged Council to get rid of these flags and create safer pedestrian crossings, council voted to continue with the flags being available at those crosswalks. And these flags are not inexpensive, with the Crosswalk Safety Society shelling out $250 to outfit each crosswalk with them.

Only 2 to 6 percent of pedestrians use these flags to wave at cars when they are crossing, and when a reporter watched an intersection for two hours, pedestrians did not use the flags at all.

The concept of intersection flags have been tested in Berkeley California and in Seattle and were dismissed as being ineffective and giving pedestrians a fake sense of confidence. It also puts the onus on the pedestrian for getting the driver’s attention and stopping a vehicle, something that should be the responsibility of the driver.  For small children, using flags is one more thing to take attention away from the important task of simply safely crossing the road.

Kudos to municipal staff in Halifax that conducted their own tests at two intersections, crossing each of them three hundred times.  “They found that drivers gave way 94 per cent of the time when flags were being carried and 89 per cent of the time at crossings where there were no flags. Driver compliance was lowest, at 86 per cent, when flags were present but not carried”.

No matter what the political reasons are for allowing a group to place flags on crosswalks, that  does not address the issue of making the street safer for pedestrians to cross. CityLab explored flags and crosswalks four years ago and concluded that asking people to carry a flag when crossing a street does not put the pedestrian first. Fort Lauderdale tried this as  “a multipronged effort to improve drivers’ awareness of laws that require them to stop at marked crosswalks”. 

What does it take to change driver behaviour at crosswalks? CityLab reports that an observational study by Active Transportation Alliance showed that only 18 percent of drivers stopped for pedestrians at marked crosswalks. Flashing lights and raised or textured crosswalks raised the stopping rate to 61 per cent. This study was done in Chicago where Illinois law requires vehicles to stop for pedestrians crossing the road.

Why do drivers not stop at crosswalks? CityLab suggests that it is not only the way streets are designed to encourage traffic flow, but also that people “don’t walk very much themselves. They don’t project themselves in the pedestrian’s frame of mind when they’re driving, because they are rarely in the pedestrian’s position at any other time.”

That response suggests that as sustainable cities encouraging aging in place and supporting active transportation that more education, enforcement of driver behaviour and speed, and better street crossing design is needed to keep the most vulnerable road users-pedestrians~safe and walking.

Unbelievably the City of Cupertino California has a video showing how flags are to be used while crossing a  street on the way to school.No surprise that the “thumbs up and down” buttons and comments have been disabled on this video.


Designing for Pedestrians and Cyclists Boon for London Retail Businesses

Of course it makes intuitive sense that active transportation users and bus commuters would frequent retail businesses more often than those constrained by  vehicles. But it is always better to have the hard facts on this data, and researchers in the City of London England have done just that.

Transport for London (TfL)  in Great Britain has released a new study  with some staggering statistics about what happens when street improvements are made to facilitate walking and cycling. Time spent on retail streets increased by 216% between shopping, patronizing local cafes and sitting on street benches. Retail space vacancies declined by 17%.  London’s Business Improvement Districts are 90% in favour of more street improvements to facilitate pedestrians, and 85% in favour of better facilities for cyclists.

But the best news, and this is also in line with research conducted in Toronto and in New York City “people walking, cycling and using public transport spend the most in their local shops, spending 40% more each month than car drivers”.

The study for TfL was conducted by a researcher at University College London’s Bartlett School of Planning. Footfall and retail sales in unimproved areas were compared to shopping areas that had implemented improvements such as wider sidewalks, increased outdoor seating, public parks and pedestrian crossings.  Findings showed that retail rents  increased by 7% in improved areas, and office space rents increased by 4%, suggesting that the street improvements translated into much more desirable spaces. You can download the entire report, which also has some great business case references for retail areas  here.

Local business improvement districts in London are also understanding the benefits of increased pedestrian and cycling clientele, with 90% seeing the advantages of pedestrian improvements and 85% wanting more cycling facilities in their area.

Will Norman, London’s Walking and Cycling Commissioner, said: ‘With businesses across London really struggling to survive, we have to do everything we can to support them.‘The evidence is clear – adapting our streets to enable more people to walk and cycle makes them cleaner, healthier and more welcoming, which encourages more people to shop locally.‘The benefits of designing streets around pedestrians and cyclists and reducing car use can be enjoyed by everyone and will help ensure the future of our high streets.’

And of course, more pedestrians and more cyclists on separated facilities, improved street design and slower speeds make roads safer and encourage travel to retail businesses by active transport, and make retailers more money.  This BBC video below has been just released talking about Vision Zero and how to make the streets of London safer for everyone.


Is New York City’s Times Square the Walkability Blueprint for Other Cities?

IMG_0737

What used to be a very seedy, dirty and crowded area of New York City has undertaken a dramatic renewal as a place for people to linger, chat, and just hang out. Even though the land on Broadway between 42nd and 47th Streets is less than .01 per cent of the actual surface of New York City, it is responsible for 11 per cent of the city’s economic output.
With 330,00 people visiting daily, Times Square has a mix of about 56 per cent locals to 44 per cent of tourists. Through Janette Sadik-Khan’s championing of Times Square as a people not a vehicle place, there has been a remaking of this place by simply making it more and more pedestrian friendly.

IMG_0373

Walk Metro Vancouver was in New York City in May 2009 when Broadway Avenue was being closed down for traffic, and the NYC Department of Transportation and the  Department of Design and Construction got rid of the old foggy stuff in the square and brought in streamlined fifty foot long granite benches. The transformation was immediate. People sat down on what ever seating device was available, including the green stamped concrete.

As reported in Mic.com, the architecture and landscape firm Snohetta led the process to design the new plaza, including the public and city officials in the discussions.Curbs were eliminated, the “temporary” pedestrian plazas were made permanent. Over twenty agencies and public interest groups had previously been involved in plans to change this area ,with none successful. So what made the difference?
Craig Dykers, the founding partner of Snohetta observes:  “For half a century, numerous plans for Times Square had been proposed by designers to help Times Square meet its changing needs and manage pedestrian and vehicular congestion. None of these plans found traction or were approved.” But by recognizing that 300,000 people a day travel by foot through the area and making those pedestrians~and their interaction with the space~ a priority, this has been a great success.  With the project officially completed in 2016, “There’s been a 20% decrease in crime, a 40% decrease in pedestrian injuries and a 60% decrease in pollution.” 

Eighty per cent of users say the space feels safer, and 93 per cent say it’s a more pleasant place. “Cities need to be smart,” Craig Dykers stated. “It is critical now more than ever to evaluate how much space is needed for cars and traffic and ask if there is space that would be better tailored to pedestrian use.“In each case, we must ask: Does removing the street provide value for users as well as adjacent businesses? How can we continue to cultivate open, vibrant and unique public spaces that increase public safety and promote diverse ways of thinking? These are questions that are being asked with greater urgency, especially as issues of pedestrian safety and secure public space are more pressing than ever.”

IMG_0378

Carson City Nevada Steps Up to a Walkable Downtown

22552958_1677729645572537_1326480646615013031_o.jpg


Walk Metro Vancouver has reported on a phenomenon that is occurring in many towns that are reclaiming their historic downtowns back from thoroughfare highway use to more pedestrian friendly sidewalks, bike lanes, and slower vehicular flows more attractive for locals.

Carson City Nevada is 30 miles south of Reno, has a population of 55,300 (2010) and is also the state capitol of Nevada. Despite a downtown that contained a lot of important heritage buildings as well as the grounds for the state capitol, motordom reigned supreme on the main street. Four lanes of traffic went through Carson Street at speed, and pedestrians were hurt and killed trying to cross the street. At one point the City installed fence barriers along the narrow sidewalk to try to separate pedestrians from vehicles. It did not make for an inviting experience on this main commercial street.

With the use of a 1/8 per cent  local sales tax, the City was able to issue bonds to pay for a revamping of their downtown corridor. Utilities were replaced under the road surface, and the street made more walkable and visually interesting by the use of  new wide non glare sidewalks, plantings, dropped curbs, pedestrian activated crossings, bike lanes, and attention to detail in textures and materials.

22406444_10212421879055291_5271322934965050929_n

Opened in the Fall of 2016, Walk Metro Vancouver visited the street  to see how the street was functioning, and whether the improvements were a success. Mayor Bob Crowell noted that there had been no pedestrian accidents on the street since the new street treatment had been installed. The new street is designed to maintain cars travelling at the posted speed and no faster. There are quick activation pedestrian crossings throughout the downtown. The design and development of a plaza on a previously opened street has a stage and a kid friendly splash pad, and has small local businesses and outside seating areas for people to linger.

22449988_1611348775577032_8524299812076313740_n

But most importantly,  “early adapter” businesses that focus on all segments of the local population have opened, most notably “Scoups Ice Cream and Soup Bar with engaging staff, a plethora of ice cream flavours, and a ready-made place for kids of all ages to hangout and reflect in the adjoining plaza. As several teenagers admitted, there was no reason to come to the main street of Carson City before, as there was nothing of interest. Now with an  ice cream and soup bar and open seating outside the store, teenagers feel comfortable and have a sense of belonging in the plaza. That is what successful placemaking is all about.


It is no surprise that many locals now are using the downtown Carson Street in a different way, as a place to walk to and to linger. As well new eateries have opened, including The Union which is always busy and attracts hungry visitors from Reno.
Carson City now has a “there there” in their downtown, and is experiencing a renewed interest in its downtown commercial area. The city has a strong arts focus and now has a downtown that is accessible and attractive to pedestrian and bicycle users. Buildings along Carson Street are being renovated, and a new mixed use building with rental apartments on the top floor is being built on a sidestreet. Carson City’s decision to shelve motordom and to enhance local shopping by bike and by foot is already reaping early returns.


 22405521_1611345052244071_400518240779704761_n

San Francisco Shrinks Fire Trucks as a Response to Vision Zero

neworleansfiretruck


In designing streets for all users and throating down vehicular traffic people often ask if emergency vehicles and fire trucks can navigate the newly designed spaces easily and quickly. There are approved geometric design guides, as well as software programs to ensure that these vehicles can manoeuvre more constricted spaces easily. And now all fire trucks don’t need to be built to the old specifications either. This story from Streetsblog describes Fire Engine 13 in San Francisco’s Financial District that is “narrower, not as long, and has a better turning radius,” said San Francisco Fire Department Chief Joanne Hayes-White. “It’s a beautiful piece of equipment.”

Eight new fire engines in San Francisco are ten inches shorter than the standard older trucks and can make a u-turn in 25 feet. The shorter design enables the engine to manoeuver San Francisco’s curving streets. The engines also include on board cameras to give a full 360 degree view around the engine, enhancing safety for cyclists and pedestrians, following the Vision Zero edict every life is precious.

All eight of the new engines are expected to be in service in December. The new fire engine is actually in response to City Hall Supervisor Scott Weiner requesting that the trucks  be designed to fit the city, instead of the city streets being designed to fit a certain size of fire truck. Both Walk San Francisco and the San Francisco Bicycle Coalition collaborated on the design.

Each engine cost over $500,000  American dollars and are anticipated to run for 15 years. The engines will go to “stations that respond to calls in the densest areas of the city, with the most alleys and narrow streets, such as Chinatown and the Financial District.” 

San Francisco is also looking at replacing their aerial ladder trucks with a design that can work over parking protected bike lanes and other street amenities. Sometimes it is just better to change the size of the service vehicle providing much-needed emergency services than to overbuild streets for the infrequent emergency event.

strongtowns-2-838x0_q80-650x0_q70_crop-smart

New York City and the Dog Parker

dog-parker_july2016_brooklynnyc_08


Imagine that you are walking downtown with your dog and decide to go to a restaurant, or shop. It is clear that your dog should not be accompanying you. As the New York Times contributor Jonathan Wolfe writes someone has thought about this dilemma and has come up with a solution in the form of pink and white kennels on commercial streets that you can rent for your dog.


Called the Dog Parker, these temperature controlled kennels have webcams inside, temperature controlled, and cost 20 cents a minute to use.
You register for the service, get a fob that allows you access to the kennels, and  you can use the 45 Dog Parker “houses” in Brooklyn,  or the new “houses” to be installed in other New York City locations in December. Dog Parker customer service maintains a 24 hour presence, and  can remotely unlock the kennel if the dog owner loses the fob. The intent of these kennels is to provide  “an alternative to leaving a dog at home or tying them up to a pole as one shops.” 

Not surprisingly reaction to this innovation has been mixed. As one dog owner observed “I think it’s the worst idea in the world. I would never take my dog anywhere where I would have to leave them in a box or tied up.” Other dog owner interviewed suggested that instead of a lock box for a dog outside a store, regulation needed to be updated to allow people to access shops and services with their animals.

The Dog Parker company has been in business since last year and is actively soliciting businesses to install the kennels outside their businesses to become a “dog-friendly” establishment, capturing customers with dogs, and minimizing liability by having the dogs inside their establishments. Only in New York City so far.

64047696-64047990